Manipulating Res Ipsa
Posted on October 13, 2019
Introduction and Example
A recent torts cases from class (Byrne v. Boadle) served as the introduction to a class of problems where negligence could be considered probabilistically. This set of problems mirrors the more well-known "false positive" problem. Here are two ways to state what is mathematically the same exercise.
"False Positive" problem: A disease afflicts $0.1\%$ of a population. A test exists for the disease, and will show positive $90 \% $ of the time if you have the disease and $1\%$ of the time if you don't (false positive). If you test positive, what is the probability you have the disease?
Negligence problem: Employees of a company act negligently $0.1\%$ of the time they load barrels next to a window. If they act negligently, an accident occurs $90\%$ of the time. When they are not negligent, an accident occurs $1\%$ of the time. If an accident occurs, what is the probability it was due to negligence?
Both have the same solution (we'll use the negligence nomenclature). Define $P_1$, $P_2$, and $P_3$ per the table below.
| Probability | Disease Problem | Negligence Problem |
|---|---|---|
| $P_1=1\%$ | False positive | Accident, not acting negligently |
| $P_2=90\%$ | True positive | Accident, acting negligently |
| $P_3=0.1\%$ | Prevalence of disease | Rate of negligence |
Let's say an accident occurred. The probability an accident occurs through negligence is $P_{negligence}=P_2\cdot P_3=0.00999$. The probability an accident occurs without negligence is $P_{no-negligence}=P_1\cdot(1-P_3) = 0.0009$. Therefore the probability it was due to negligence is: $$ \frac{P_{negligence}}{P_{negligence}+P_{no-negligence}} = 8.3\%.$$ So $8.3\%$ of the time it is due to negligence (or isomorphically, there is an $8.3 \% $ chance you have the disease despite a positive test).
So should this example drive our intuition? Unless this pattern of low rates of negligence holds for a majority of inputs, the answer is a resounding no.
Let's change the problem slightly by making the probability of accident from non-negligence $P_1=0.1\%$ and the rate of negligence $P_3=1\%$. Intuition would tell you negligence is more likely to have been the cause, but by how much? If you work through the same math, the probability the accident was due to negligence now becomes $90.1\%$. Clearly, this problem is susceptible to manipulation through small changes in the inputs.
DIY Inputs
Try a few different cases yourself and see if you can game the outcome. What are the driving variables?Changing $P_1$ and $P_3$
We were able to "flip" the outcome by flipping $P_1$ and $P_3$, so let's look at the probability of negligence as we vary those two variables. Plots can be generated with the following code.
import matplotlib.pyplot as plt

steps = 201
array2d = [range(steps) for _ in range(steps)]

interval = .0005

for i in range(steps):
    for j in range(steps):
        p1 = interval*(i+1)   # probability of drop if properly handled
        p2 = .20              # probability of drop if improperly handled
        p3 = 1-interval*(j+1) # probability of handled properly

        pa = p1*p3            # handled properly but dropped
        pb = (1-p3)*p2        # handled improperly and dropped

        p_proper = pa/(pa+pb)
        array2d[j][i] = p_proper

plt.contourf(array2d, 9, vmin=0.0, vmax=1.0, origin='lower',
             extent=[interval * 100, interval * steps * 100, interval * 100, interval * steps * 100],
             cmap='seismic')

cbar=plt.colorbar()
plt.xlabel('$P_1$, probability of accident, not acting negligently (%)')
plt.ylabel('$P_3$, rate of negligence (%)')
plt.title('Probability that Accident Happened through Negligence, $P_2 = 20\%$')

cbar.set_ticks([0, .2, .4, .6, .8, 1])
cbar.set_ticklabels([0, .2, .4, .6, .8, 1])

plt.show()
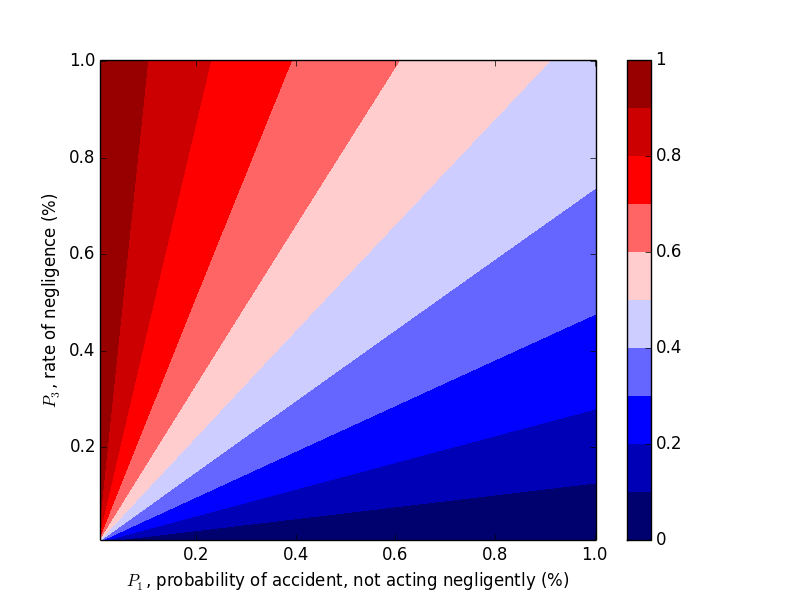
This trend makes sense in hindsight, but one should hardly be expected to carry this intuition around with them, naturally or otherwise.
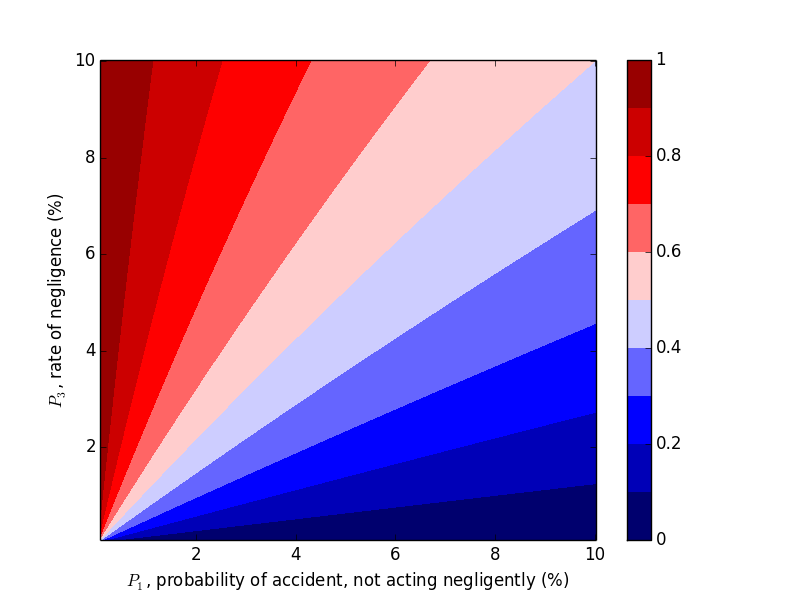
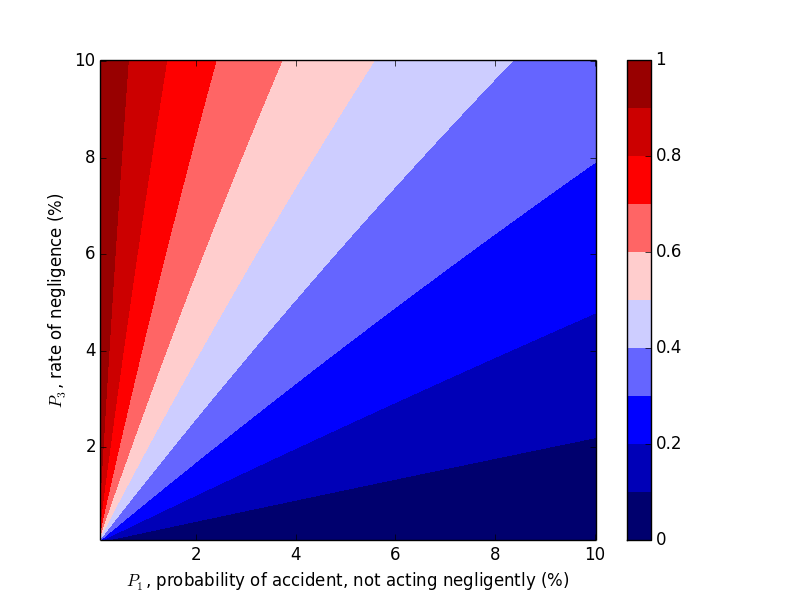
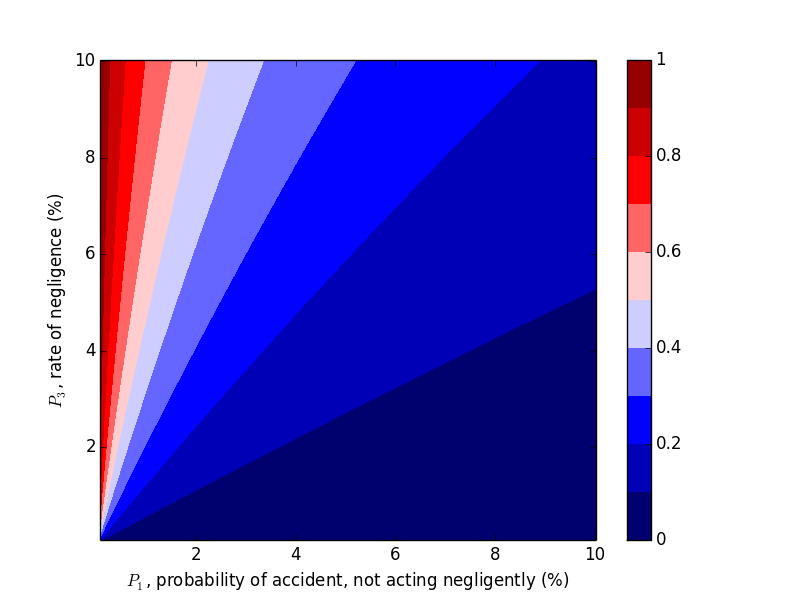
Changing $P_2$
Now let's work with $P_2$. Compare the above plots where $P_2=0.9$ to the plots below where $P_2=0.2, 0.5$. We would expect decreasing $P_2$, probability of an accident given negligence, to decrease the probability of negligence given an accident, which the plots below confirm.
Takeaways
With these results, we can develop a general intuition:
- If $P_2$ is sufficiently low, an accident is probably not due to negligence.
- If $P_2$ is sufficiently high and $P_1>P_3$, then the accident was probably not due to negligence.
- If $P_2$ is sufficiently high and $P_1 < P_3$, then the accident was probably due to negligence.
That said, a more important takeaway here is simpler: don't let a limited data set drive your intuition. Look at the sensitivity of the variables involved, and look at a wide swath of results before jumping to conclusions. And unless you have a clear reason to, don't arbitrarily assume probabilities. You probably don't know the difference between $0.1 \%$ and $1 \%$ without a good data set to aid you.